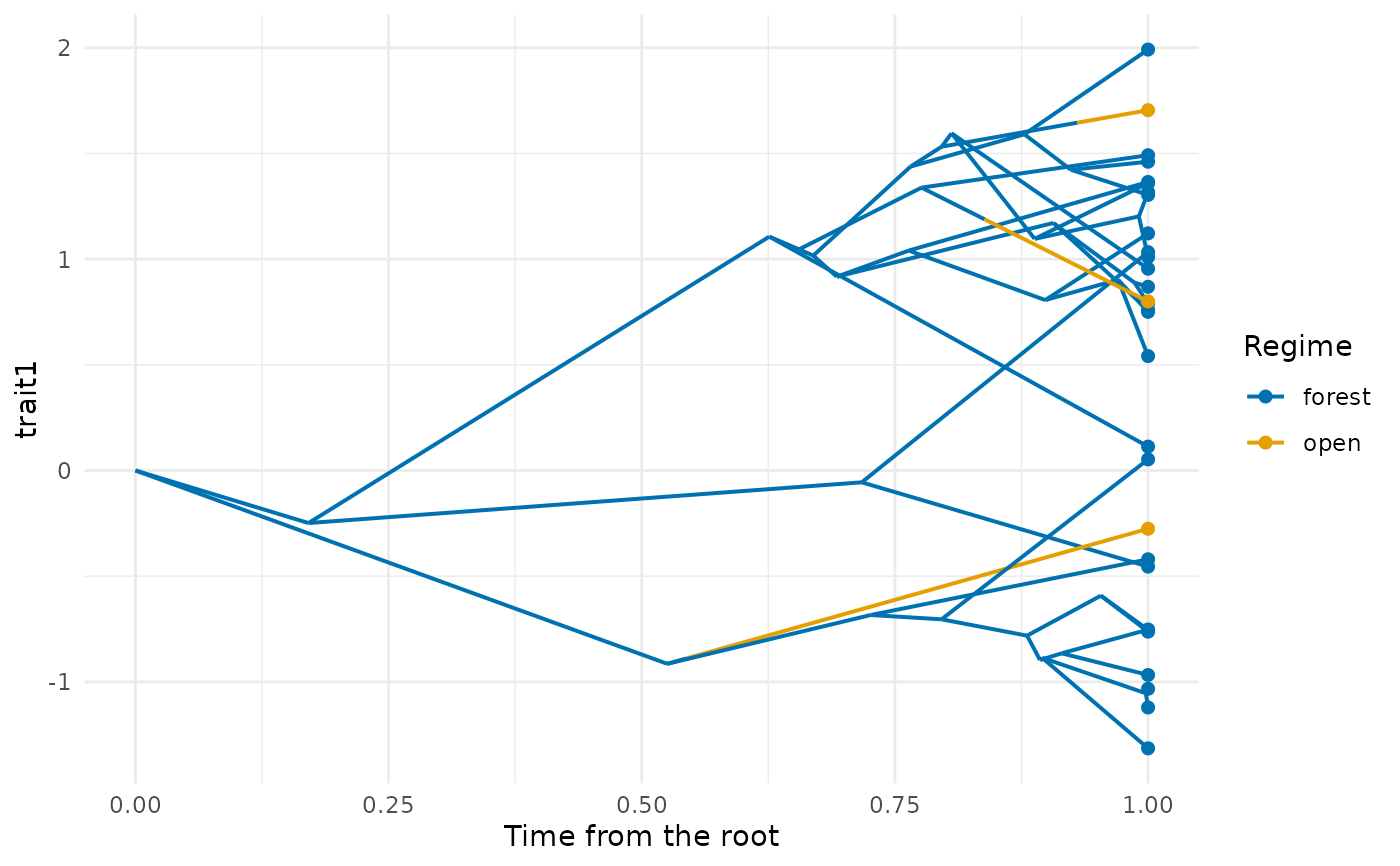
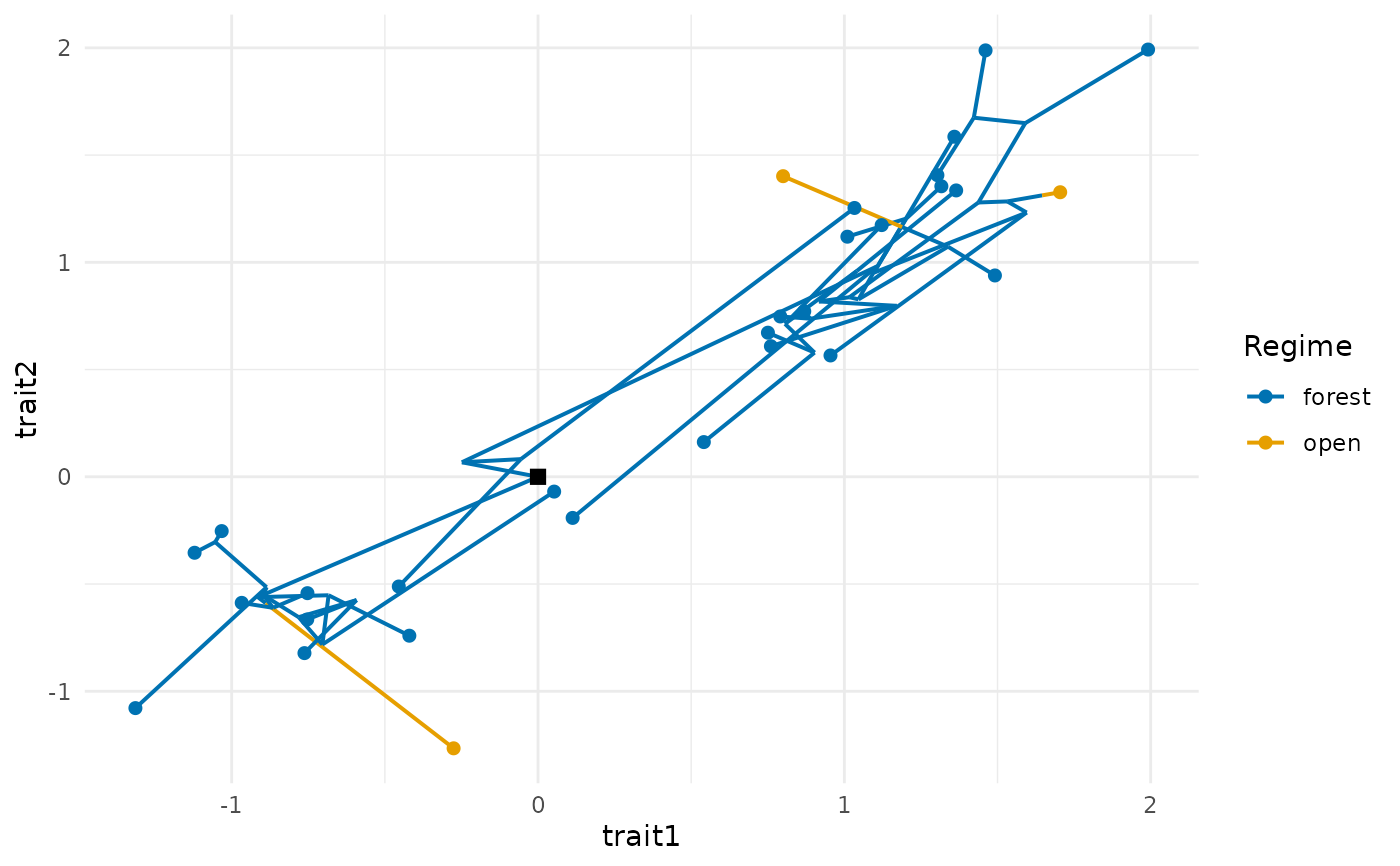
Draws simulated traits with the tree that generated them. With two traits, a phylomorphospace: the tips and internal nodes in the plane of the two traits, joined by the branches of the tree. With one trait, a traitgram: the trait against time from the root. Branches are coloured by selective regime, with the change of colour at the point of each shift in a mapped history.
Usage
plot_traits(
  x,
  tree = NULL,
  traits = c(1, 2),
  regimes = NULL,
  colours = NULL,
  tip_labels = FALSE,
  legend = TRUE,
  point_size = 1.8,
  linewidth = 0.7,
  ...,
  labels = NULL
)
Arguments
- x
Traits of the tips from
trait_ou(): a matrix with one row per tip, named by tip label.- tree
The tree of
x, aphyloobject; orNULLto draw only the tips.- traits
The two columns of
xto draw (names or numbers), or one for a traitgram.- regimes
Regimes of the branches, as in
trait_ou(): a vector in the cladewise order of the edges (frompaint_regimes()) or a tree with a mapped history (classsimmap, fromtrait_mk()).NULLdraws every branch in one colour.- colours
Colours of the regimes, named by regime or in the order of the sorted regimes; one colour when there are no regimes.
- tip_labels
Should the tips be labelled?
- legend
Draw the legend of the regimes?
- point_size
Size of the tips.
- linewidth
Width of the branches.
- labels, ...
Deprecated:
labelsis nowtip_labels; graphical arguments of base graphics are no longer used (modify the ggplot object instead).
Details
The values of the internal nodes are those kept by trait_ou() in the attribute nodes,
so the branches show the simulated path between nodes, not a reconstruction. Without that
attribute, only the tips are drawn.
See also
trait_ou(), rate_matrix() and plot.rate_matrix().
Other species traits:
arrival_ages(),
as_herodotools(),
food_web_rates(),
history_rates(),
paint_regimes(),
partner_turnover(),
plot.rate_matrix(),
plot_rates(),
rate_matrix(),
region_pool(),
species_traits(),
tip_history_metrics(),
trait_bm(),
trait_mk(),
trait_ou(),
trait_rates(),
turnover_rates()
Examples
set.seed(2)
tr <- treeshapesim::sim_tree_shape(30)
habitat <- trait_mk(tr, q = 0.5, states = c("forest", "open"))
r <- rate_matrix(c(1, 1), correlation = list(forest = 0.8, open = -0.8),
constraint = "variance")
x <- trait_ou(habitat, sigma2 = r, regimes = habitat)
plot_traits(x, habitat, regimes = habitat)
 # traitgram of the first trait
plot_traits(x, habitat, traits = 1, regimes = habitat)