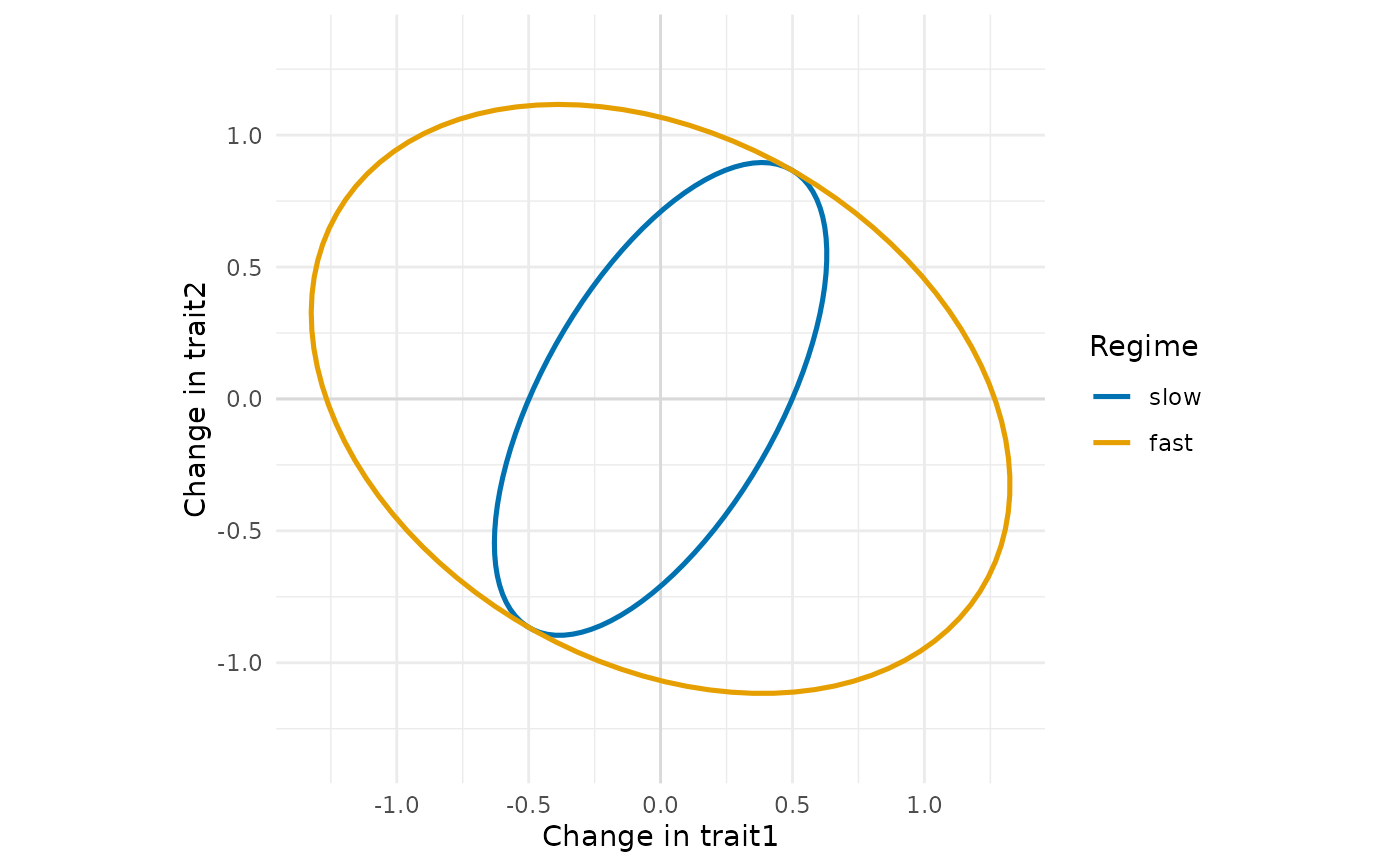
Draws each rate matrix as the ellipse of the changes of two traits per unit time (one standard deviation by default), one ellipse per regime. The shape shows the evolutionary correlation, the size the rates: proportional matrices give nested ellipses of the same shape, shared eigenvectors give ellipses with the same axes, equal variances give ellipses inscribed in the same box.
Arguments
- x
A
rate_matrixobject fromrate_matrix().- traits
The two traits to draw (names or numbers); with more traits, the ellipse is that of the marginal covariance of the two.
- level
Number of standard deviations of the ellipse.
- colours
Colours of the regimes, in the order of the regimes.
- legend
Draw the legend of the regimes?
- linewidth
Width of the ellipses.
- ...
Not used.