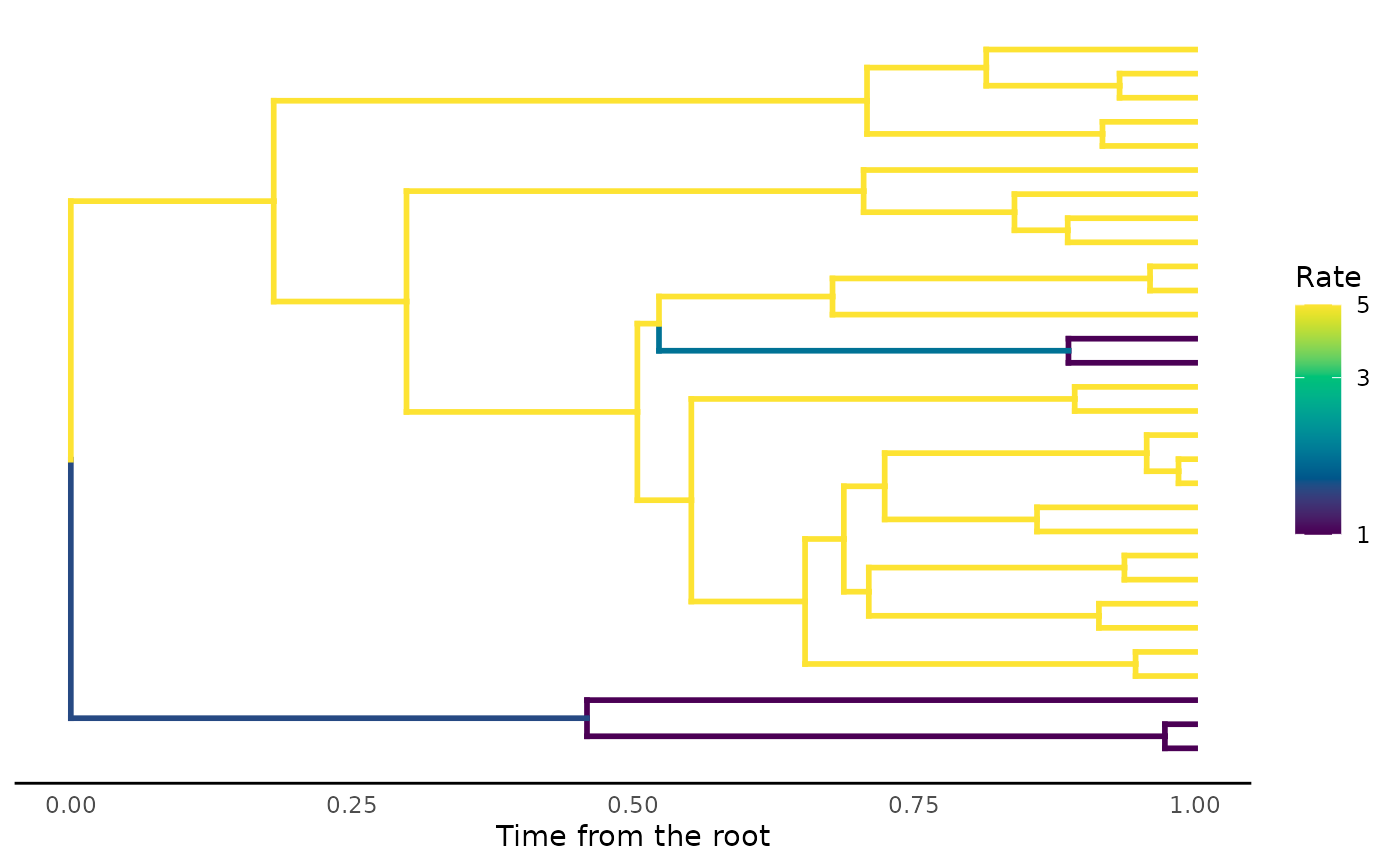
Draws the tree as a rectangular phylogram with each branch coloured by its rate. Works with
any rate per branch: the truth from trait_rates(), history_rates(), turnover_rates()
or food_web_rates(), or estimates such as those of RRphylo, as long as they follow the
order of the rows of tree$edge.
Usage
plot_rates(
  tree,
  rates = NULL,
  log = TRUE,
  palette = "viridis",
  tip_labels = FALSE,
  linewidth = 1,
  title = NULL
)
Arguments
- tree
A
phyloobject with branch lengths, or a result oftrait_rates(), which carries its tree and rates.- rates
Rate of each branch, in the order of the rows of
tree$edge, or a result oftrait_rates(), whoseedge_ratesare used. Left out whentreeis a result oftrait_rates().- log
Colour by the logarithm of the rate (the default), since rates are multiplicative. Needs positive rates; use
FALSEfor estimates that can be negative.- palette
Name of a palette of
grDevices::hcl.colors().- tip_labels
Draw the names of the tips.
- linewidth
Width of the branches.
- title
Title of the plot, or
NULL.
See also
trait_rates(), history_rates(), turnover_rates().
Other species traits:
arrival_ages(),
as_herodotools(),
food_web_rates(),
history_rates(),
paint_regimes(),
partner_turnover(),
plot.rate_matrix(),
plot_traits(),
rate_matrix(),
region_pool(),
species_traits(),
tip_history_metrics(),
trait_bm(),
trait_mk(),
trait_ou(),
trait_rates(),
turnover_rates()
Examples
set.seed(1)
tree <- treeshapesim::sim_tree_shape(30)
x <- trait_rates(tree, "shift", shifts = 2, shift_size = c(8, 1 / 8))
plot_rates(x)
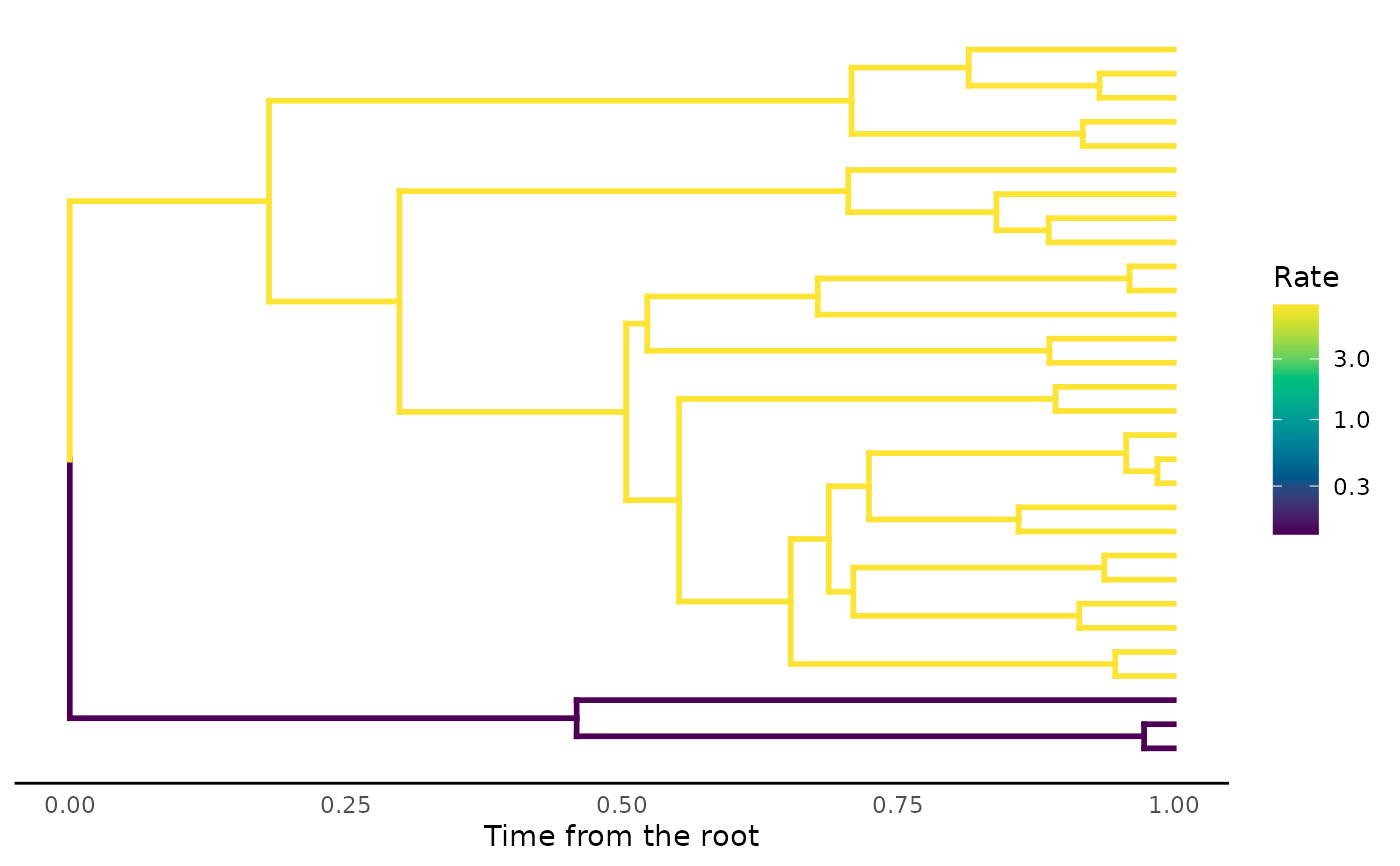 habitat <- trait_mk(tree, q = 0.5, states = c("forest", "open"))
plot_rates(tree, history_rates(habitat, "state", state_rates = c(forest = 1, open = 5)))