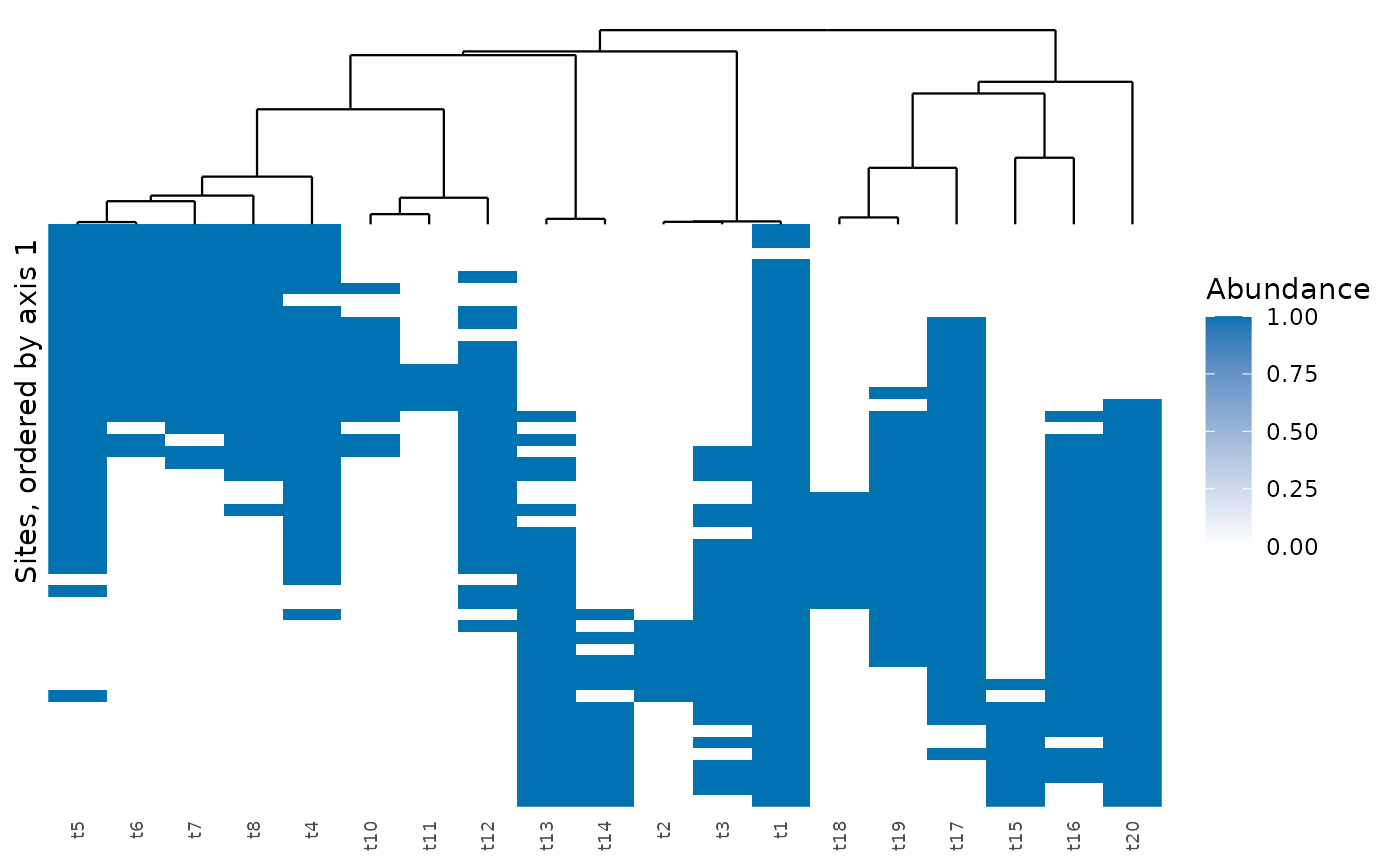
The heatmap that Peres-Neto & Kembel (2015) suggest for phylo_beta_test(): sites follow
an axis of the matrix predicted by the environment and species follow the tree, so that a
link between environment and phylogeny appears as clades that replace each other along the
sites.
Usage
plot_phylo_beta(
  x,
  comm,
  tree,
  axis = 1,
  colours = "#0072B2",
  text_size = 2.5,
  ...,
  col = NULL,
  cex = NULL
)
Arguments
- x
Result of
phylo_beta_test().- comm
The community matrix given to
phylo_beta_test().- tree
The
phyloobject given tophylo_beta_test().- axis
Axis of
x$scoresthat orders the sites.- colours
Colour of the largest value, with white for absences.
- text_size
Size of the names of species, in mm.
- col, cex, ...
Deprecated:
colis nowcoloursandcexistext_size; arguments ofgraphics::image()are no longer used.
References
Peres-Neto, P. R., & Kembel, S. W. (2015). Phylogenetic gradient analysis: environmental drivers of phylogenetic variation across ecological communities. Plant Ecology, 216, 709–724. doi:10.1007/s11258-014-0405-0
See also
Other the whole tree:
pcc_test(),
pcps_test(),
phylo_beta(),
phylo_beta_test(),
phylo_eigenvectors(),
plot.mc_pcps()
Examples
set.seed(1)
tree <- treeshapesim::sim_tree_shape(20)
traits <- species_traits(tree, lambda = 1, optima_range = c(-1, 101),
                         rmax_range = c(0, 30))
env <- runif(50, 0, 100)
comm <- simulate_static(traits, env, incidence = TRUE)$abundance
keep <- rowSums(comm) > 0
out <- phylo_beta_test(comm[keep, ], tree, env[keep], n_perm = 9)
plot_phylo_beta(out, comm[keep, ], tree)