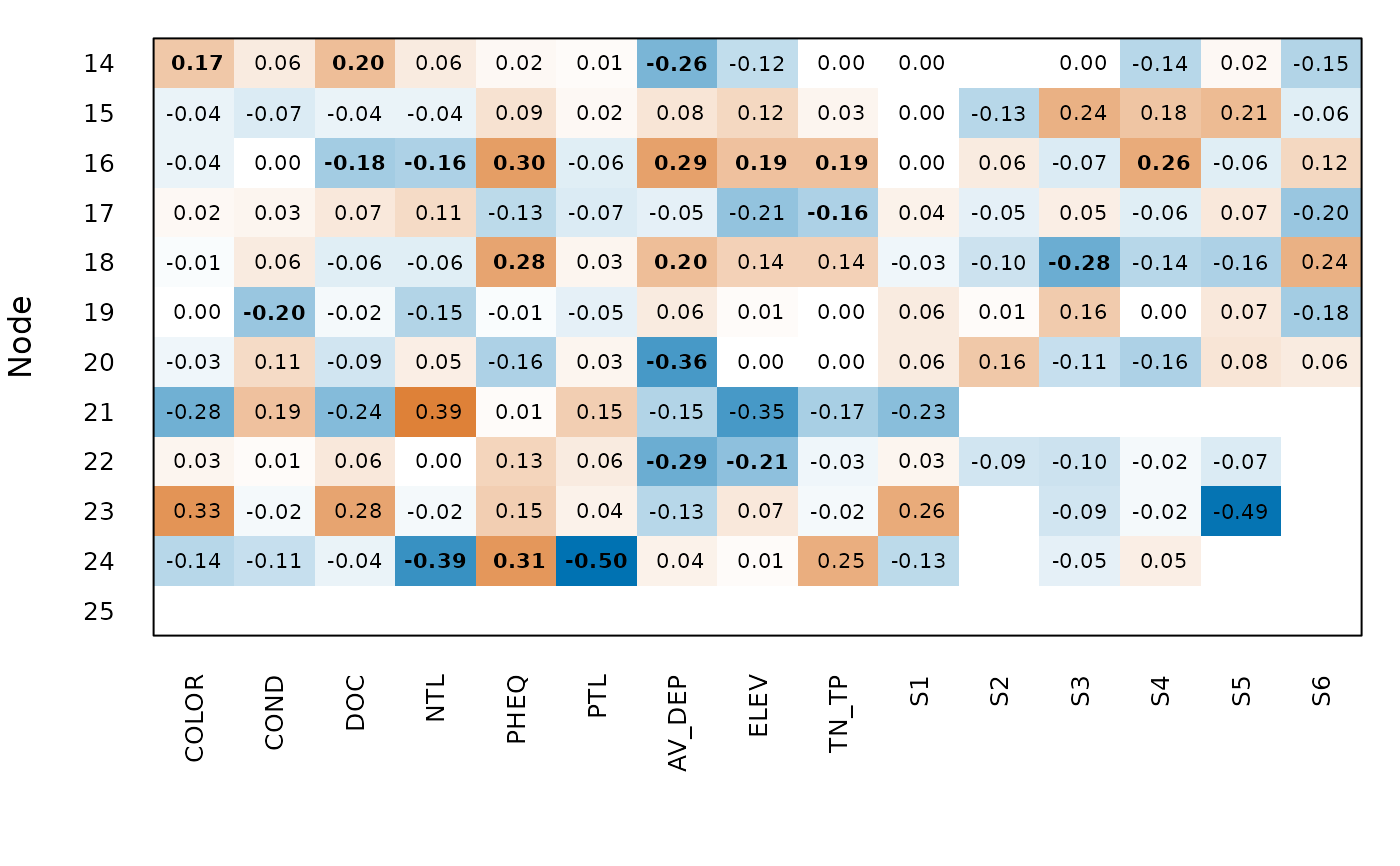
Draws a table of nodes by variables with the semipartial correlations of node_test(),
as in Table S1 of Leibold et al. (2010). Bold values with an asterisk remain significant
after the false discovery rate, as in plot_node_test(); other bold values are
significant only as isolated tests. Blank cells could not be calculated.
Arguments
- x
Result of
node_test().- test
Permutation test to show:
"max"for the larger p-value of sites and species,"site"for sites alone, or"joint"for the permutation of the article. Seenode_test()for what each one tests.- alpha
Significance level.
- col
Colours of negative and positive values.
- cex
Size of the text.
- ...
Other arguments of
graphics::image().
Value
Invisibly, the matrix of semipartial correlations, with predictors followed by biogeographic events.
Details
Rows are the node numbers of the tree. To find them, call ape::nodelabels() after
plot_node_test().
References
Leibold, M. A., Economo, E. P., & Peres-Neto, P. (2010). Metacommunity phylogenetics: separating the roles of environmental filters and historical biogeography. Ecology Letters, 13, 1290–1299. doi:10.1111/j.1461-0248.2010.01523.x
Examples
nodes <- node_contrasts(daphniids$tree)
set.seed(1)
out <- node_test(daphniids$comm, nodes, daphniids$env, daphniids$biogeography,
                 n_perm = 49)
plot_node_heatmap(out, test = "site")