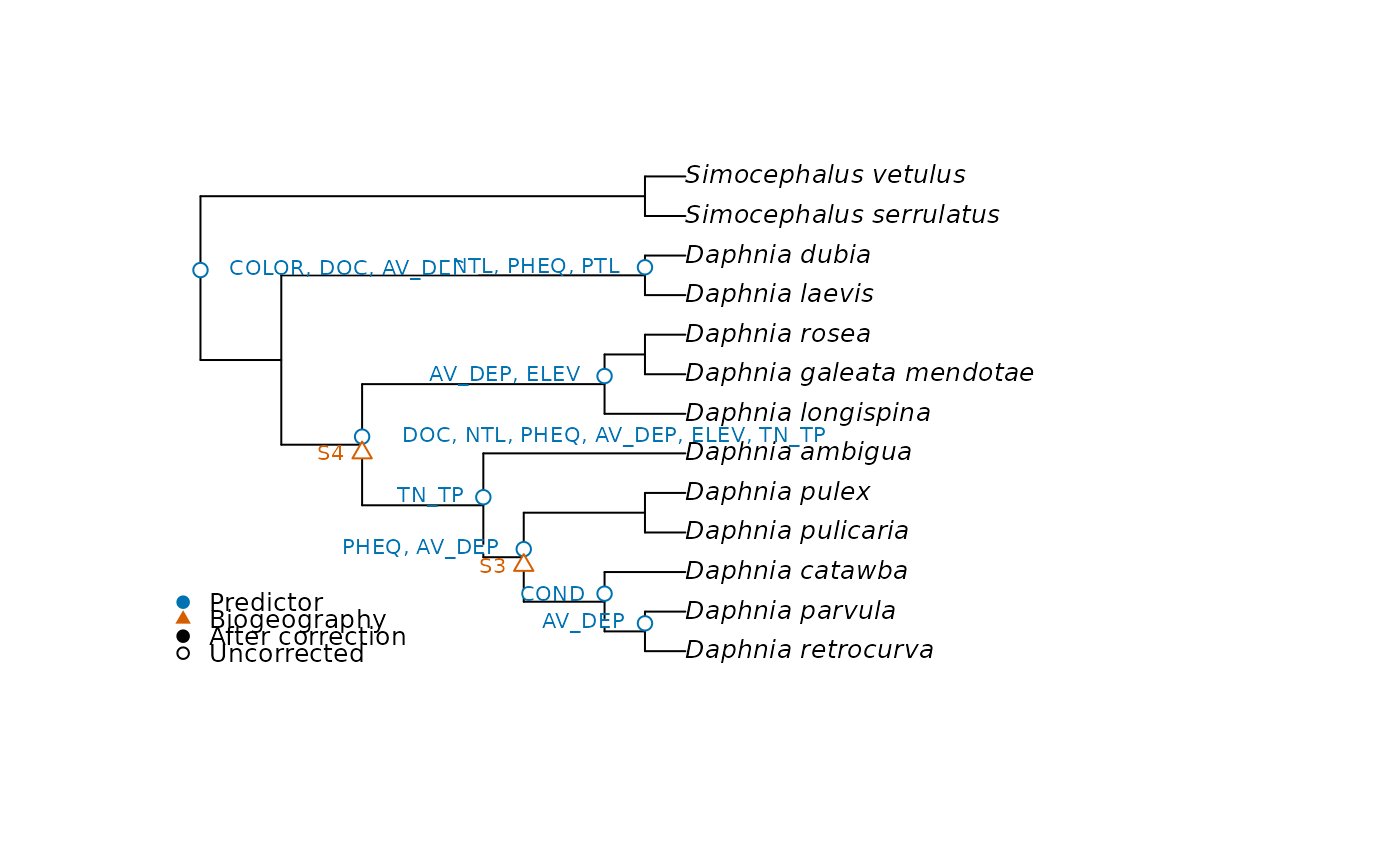
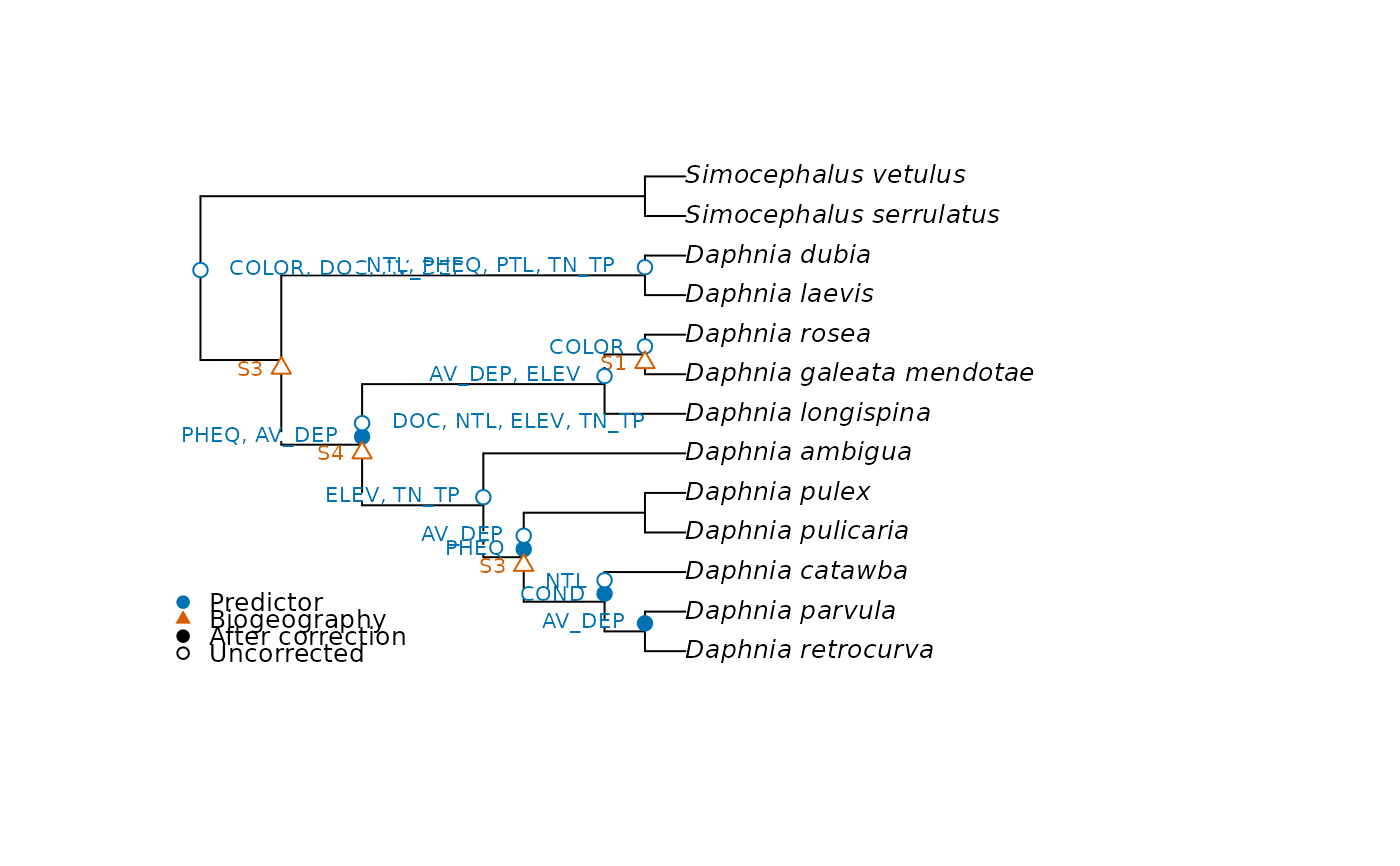
Draws the tree with the associations found by node_test() at each node, as in
Figure 3 of Leibold et al. (2010). Blue circles are predictors and red triangles are
biogeographic events, each with the names of the variables. Solid symbols remain
significant after the false discovery rate, and open symbols are significant only as
isolated tests.
Arguments
- x
Result of
node_test().- tree
The
phyloobject that gave the contrasts ofnode_contrasts().- test
Permutation test to show:
"max"for the larger p-value of sites and species,"site"for sites alone, or"joint"for the permutation of the article. Seenode_test()for what each one tests.- type
"phylogram", as in the article, or"fan", for very large trees, with the names of the variables along the radii so that they stay clear of the species.- alpha
Significance level.
- col
Colours of predictors and biogeographic events.
- cex
Size of the text.
- legend
Add a legend?
- ...
Other arguments of
ape::plot.phylo().
Value
Invisibly, a data frame with one row per symbol, with node, set, variable,
p, p_adjusted and corrected, which is TRUE for solid symbols.
Details
The article does not say which tests form a family for the correction. Here, the correction of Benjamini & Hochberg (1995) uses all nodes and variables of each set, so predictors and events are corrected separately.
As the smallest p-value is 1 / (n_perm + 1), solid symbols need many permutations.
With few species, test = "max" may leave no symbols at all (see node_test()).
References
Benjamini, Y., & Hochberg, Y. (1995). Controlling the false discovery rate: a practical and powerful approach to multiple testing. Journal of the Royal Statistical Society: Series B, 57, 289–300. doi:10.1111/j.2517-6161.1995.tb02031.x
Leibold, M. A., Economo, E. P., & Peres-Neto, P. (2010). Metacommunity phylogenetics: separating the roles of environmental filters and historical biogeography. Ecology Letters, 13, 1290–1299. doi:10.1111/j.1461-0248.2010.01523.x
Examples
nodes <- node_contrasts(daphniids$tree)
set.seed(1)
out <- node_test(daphniids$comm, nodes, daphniids$env, daphniids$biogeography,
n_perm = 49)
plot_node_test(out, daphniids$tree, test = "site")
 # \donttest{
# solid symbols need more permutations
out <- node_test(daphniids$comm, nodes, daphniids$env, daphniids$biogeography,
n_perm = 999)
plot_node_test(out, daphniids$tree, test = "site")
 # }