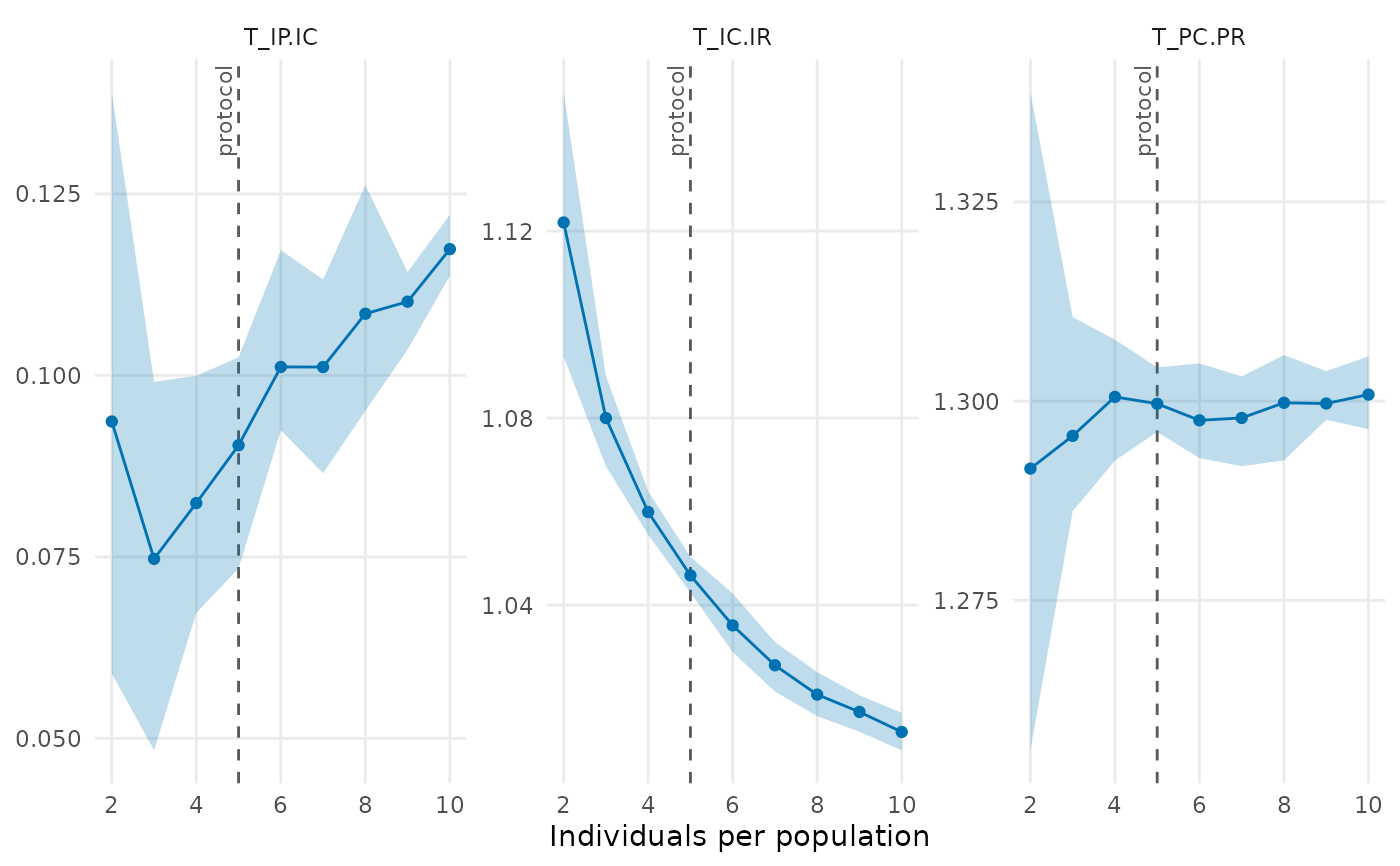
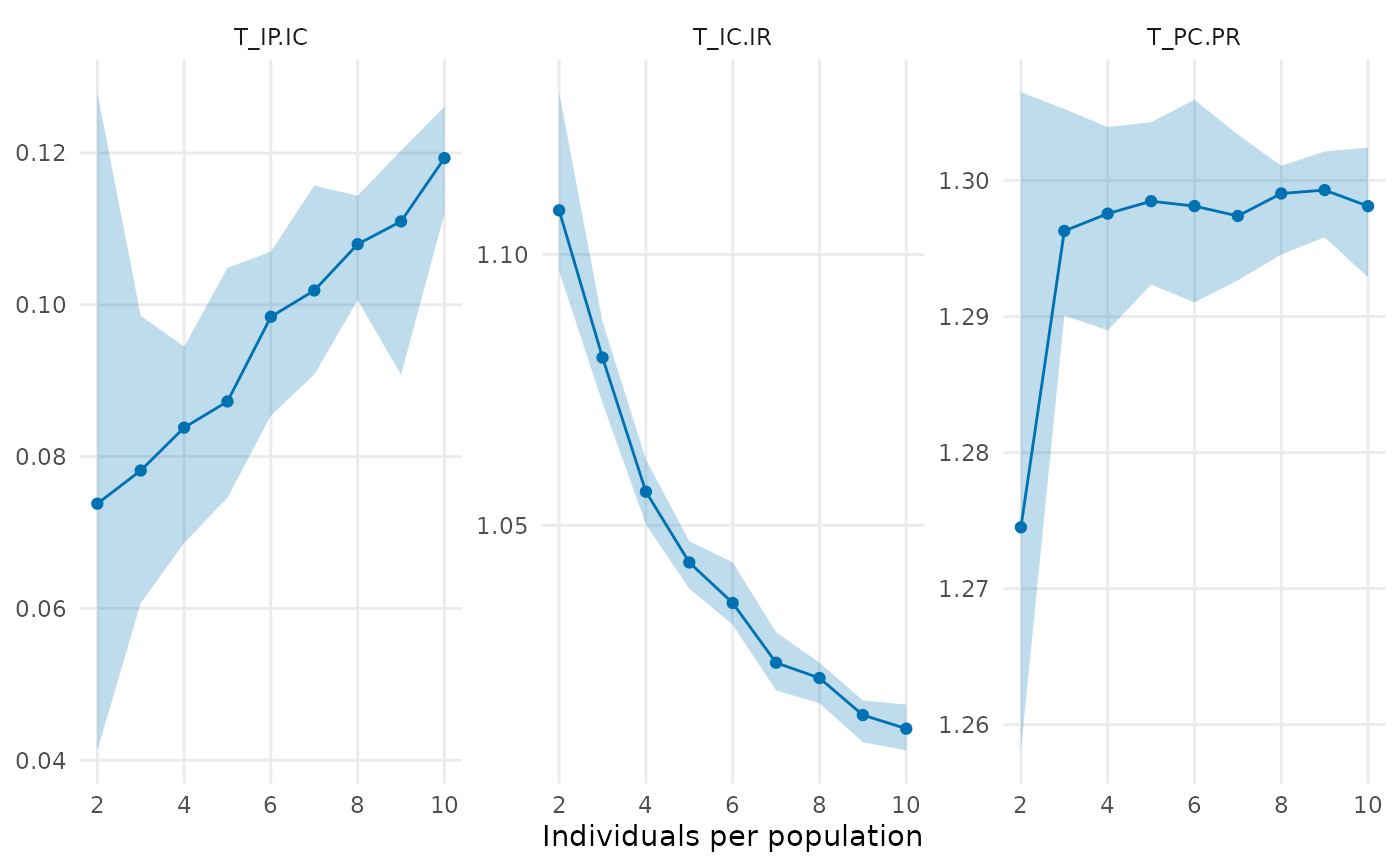
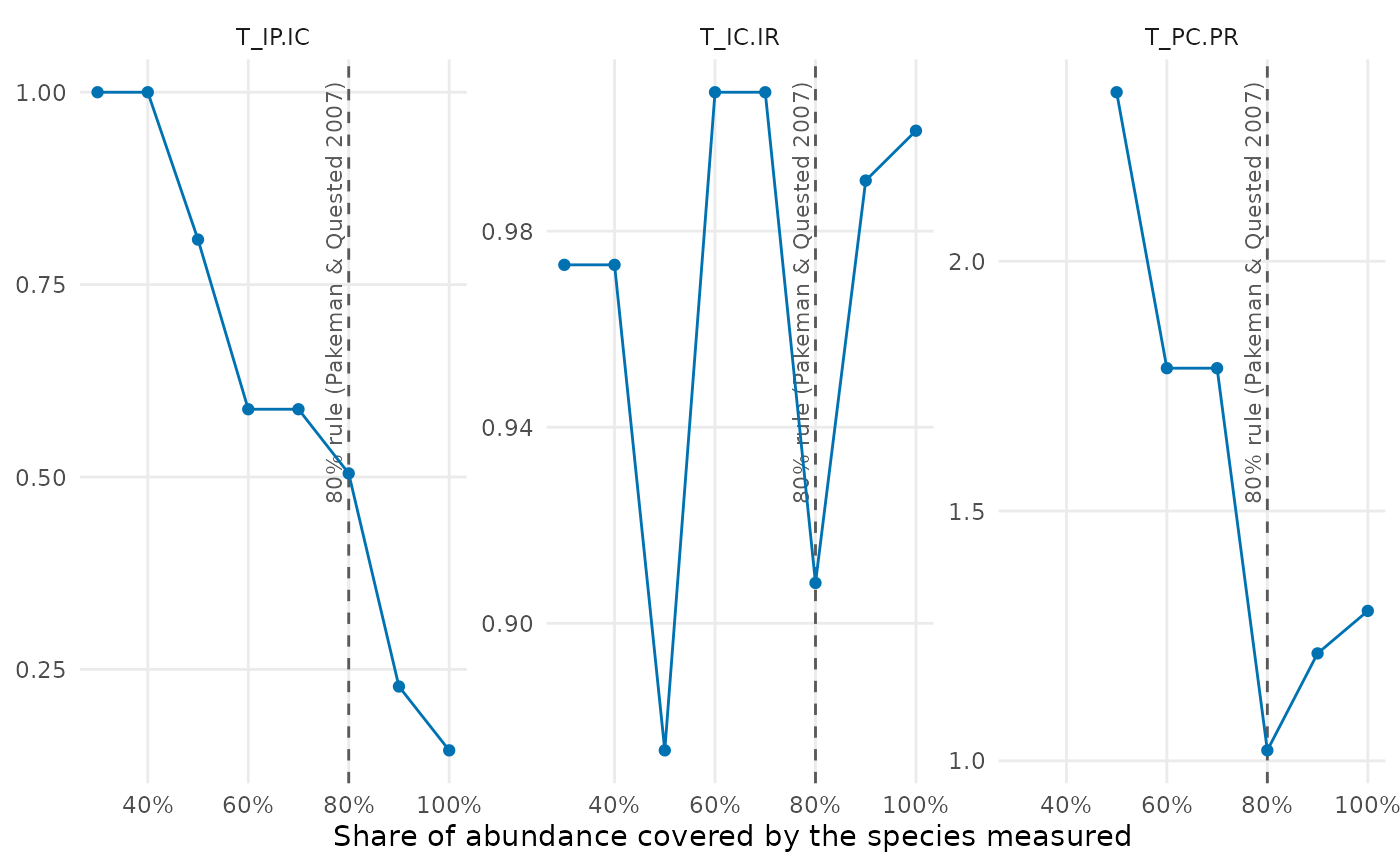
Draws the mean of each statistic from trait_rarefaction() against sampling effort, with
the interval over subsamples as a band, one panel per statistic. Dashed vertical lines mark
reference levels of effort: for a rarefaction over cover, by default the published rule of
measuring at least the species that make up 80% of the vegetation (Pakeman & Quested 2007).
No such rule is drawn by default for the number of individuals per population; give it in
reference when the field or study has one.
Usage
# S3 method for class 'trait_rarefaction'
plot(
  x,
  reference = NULL,
  colours = "#0072B2",
  alpha = 0.25,
  scales = "free_y",
  ...,
  colour = NULL
)
Arguments
- x
Result of
trait_rarefaction().- reference
Levels of effort marked by dashed lines; named values are written next to the lines.
NULL(the default) marks the 80% rule forcoverand nothing forn;FALSEdraws no line.- colours
Colour of the line and band; the default is the blue of the Okabe-Ito palette.
- alpha
Transparency of the band.
- scales
Passed to
ggplot2::facet_wrap().- ...
Not used.
- colour
Deprecated; use
colours, as in the other plots.
References
Pakeman, R. J., & Quested, H. M. (2007). Sampling plant functional traits: what proportion of the species need to be measured? Applied Vegetation Science, 10, 91–96. doi:10.1111/j.1654-109x.2007.tb00507.x
See also
Other trait variation among individuals:
community_index(),
drift_test(),
neighbour_metrics,
nested_variance(),
null_intervals(),
plot.mc_trait_gradient(),
plot.nested_variance(),
plot.trait_flex(),
plot.tstats(),
plot_population_traits(),
population_shifts(),
sample_individuals(),
subsample_individuals(),
trait_densities(),
trait_flex(),
trait_gradient(),
trait_gradient_bayes(),
trait_gradient_phylo(),
trait_gradient_test(),
trait_gradient_weights(),
trait_rarefaction(),
tstats(),
tstats_summary()
Examples
set.seed(1)
ind <- data.frame(site = rep(paste0("s", 1:5), each = 40),
species = sample(c("a", "b", "c", "d"), 200, TRUE, prob = c(5, 3, 1, 1)))
ind$trait <- c(a = 10, b = 12, c = 15, d = 18)[ind$species] + rnorm(200)
plot(trait_rarefaction(ind, n = 2:10, reps = 10))
 plot(trait_rarefaction(ind, cover = seq(0.3, 1, by = 0.1)))
 # a rule of the study, for the number of individuals
plot(trait_rarefaction(ind, n = 2:10, reps = 10), reference = c("protocol" = 5))