
simulate_lagged_series() generates pairs of multivariate
series with a known temporal relationship. It is meant for checking how
lagged_protest() behaves in a design like yours before
analyzing real data: how often it finds concordance between independent
series (Type I error), and how often it detects and locates a true lag
(power). This article explains what the function generates and shows a
small calibration study.
What the function generates
Each variable of X is a sine wave with period
period and amplitude amplitude, plus AR(1)
noise with coefficient autocorr and marginal standard
deviation noise_sd. All variables share a random phase,
offset among variables so that they do not peak at the same time, which
gives the series a two-dimensional seasonal trajectory, as in many
ecological and physiological data sets.
Y depends on true_lag:
-
true_lag = NULL:Yis an independent draw from the same generator, with its own random phase. This is the null hypothesis. -
true_lag = k:Yat time t is a linear map ofXat time t − k plus independent AR(1) noise. The map is the identity whenXandYhave the same number of variables and a random matrix otherwise.true_lag = 0is a contemporaneous association, not the absence of one.
sim <- simulate_lagged_series(n_times = 24, n_vars_x = 3, n_vars_y = 3,
                              true_lag = 3, period = 12, autocorr = 0.3,
                              noise_sd = 0.3, seed = 1)
op <- par(mfrow = c(2, 1), mar = c(4, 4, 1, 1))
matplot(sim$X, type = "l", lty = 1, xlab = "Time", ylab = "X")
matplot(sim$Y, type = "l", lty = 1, xlab = "Time", ylab = "Y")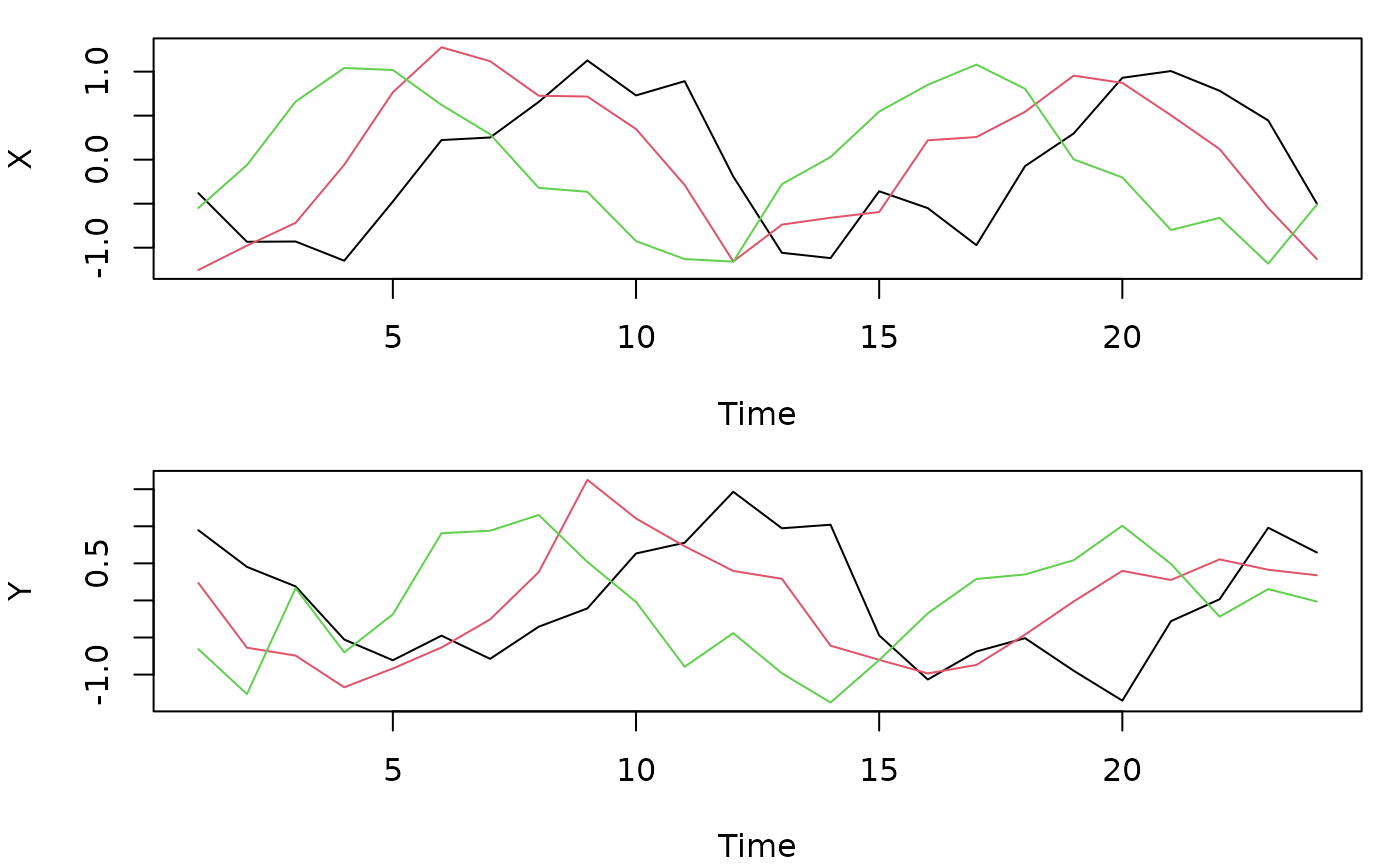
par(op)Y repeats the seasonal pattern of X three
time steps later. The scan recovers the lag:
fit <- lagged_protest(sim$X, sim$Y, lags = 0:6, nperm = 999, seed = 1)
fit$optimal_lag
#> [1] 3
fit$p.global
#> [1] 0.001
Choosing the parameters
The parameters map onto features of a real design:
-
n_times: the number of time points you have, for example 12 monthly centroids. -
n_vars_x,n_vars_y: the number of variables (or ordination axes) in each data set. More variables make concordance between independent series more likely by chance, which the permutation null accounts for. -
period: the length of the seasonal cycle in time steps. Settingperiod = n_timesgives one complete cycle;period = 12with 24 or more monthly samples gives several complete cycles; a period that does not dividen_timesgives an incomplete cycle, a case in which the test is not calibrated (see Choosing a permutation scheme). -
amplitude: the strength of the seasonal signal.amplitude = 0removes it and leaves pure AR(1) series. -
autocorrandnoise_sd: the persistence and size of the non-seasonal variation.noise_sdapplies both toXand to the noise added toY. BecauseYis a lagged copy ofX, including the noise ofX, a largernoise_sdweakens the lagged signal less than one might expect; series length has a much stronger effect on power.
A practical way of setting them is to match your data: use your
series length and number of variables, estimate the seasonal amplitude
and the residual variation from the data, and vary autocorr
over a plausible range.
A small calibration study
The function below simulates n_rep pairs, runs
lagged_protest() on each, and returns the proportion of
replicates in which the global p-value was below α, together with the
proportion in which the optimal lag matched the true one. Each replicate
gets its own seed, so the study is reproducible.
calibrate <- function(n_rep, true_lag = NULL, n_times = 24, lags = 0:4,
                      nperm = 99, alpha = 0.05, ...) {
  res <- vapply(seq_len(n_rep), function(i) {
    s <- simulate_lagged_series(n_times = n_times, true_lag = true_lag,
                                seed = i, ...)
    f <- lagged_protest(s$X, s$Y, lags = lags, nperm = nperm, seed = i)
    c(reject = f$p.global < alpha,
      lag_found = if (is.null(true_lag)) NA else f$optimal_lag == true_lag)
  }, numeric(2))
  rowMeans(res)
}
Here we use 24 monthly samples spanning two annual cycles, five variables, moderate autocorrelation and lags 0–4. With 100 replicates the estimates are rough (a rate of 0.05 has a 95% interval of about 0.02–0.11); a real study should use 1000 or more replicates and 999 surrogates.
rbind(
  type_I_n24 = calibrate(100, true_lag = NULL, period = 12, autocorr = 0.5,
                         noise_sd = 0.5),
  power_n24 = calibrate(100, true_lag = 2, period = 12, autocorr = 0.5,
                        noise_sd = 0.5),
  power_n12 = calibrate(100, true_lag = 2, n_times = 12, lags = 0:3,
                        period = 12, autocorr = 0.5, noise_sd = 2)
)
#>            reject lag_found
#> type_I_n24   0.03        NA
#> power_n24    1.00      1.00
#> power_n12    0.58      0.95
The first row should be close to 0.05. The second shows that two years of monthly data detect a two-month lag almost always. The third, with a single year of noisier data, shows that the global p-value detects the lag far less often even when the optimal lag is still usually the true one: the lag is easier to locate than to declare significant.
Extending the study
The same function covers other questions by changing its arguments:
- compare schemes by adding
permutation = "cyclic"to the call oflagged_protest(); - test the effect of an incomplete seasonal cycle with, for example,
n_times = 24, period = 18; - check robustness to non-seasonal series with
amplitude = 0; - use data sets of different dimension with
n_vars_xdifferent fromn_vars_y.
For larger studies, run the replicates in parallel (for example with
parallel::mclapply() or the future framework);
because each replicate has its own seed, results do not depend on how
the work is split.